Customer Inquiry
This window provides key metrics of an account's water consumption (per MIU / endpoint ID) displayed in the following reports:
- Monthly Consumption Analysis.
- Daily Consumption Analysis.
- Hourly Consumption Analysis.
You can view detailed customer information by searching on the following:
- Account Number – ID number assigned to the customer of the utility.
- Customer Name – Name associated with the customer account.
- Meter ID / MIU
 Meter Interface Unit, also called an endpoint, that captures water consumption readings. ID – ID for the endpoint at the customer location and the endpoint the meter uses.
 - Address – Address where the meter is located.

What You Can See and Do in This Window
Click a link to display the related information or step-by-step procedure.
| – | – | |
|
– |
– | |
| – | ||
| – | ||
| – | – | |
| – | ||
| – | – | |
| – | – | |
| – | – | |
| – | ||
|
– |
– |
|
| – | ||
| – | – | |
| – | – | |
| – | – | |
| – | ||
| – | – | |
|
– |
– | |
| – | ||
| – | ||
| – |
Search for an Account
You must know either the first letter of the account name, or the first digit for the account, address, or meter ID / endpoint ID to use for the search criteria.
-
On the Neptune® 360™ navigation bar, click Customer Inquiry.
- On the Customer Inquiry page, in the Search By field, select the criteria on which you want to search.

- In the search criteria field, type a partial or full search word or phrase, and then click
 .
.
The Choose Account window is displayed.
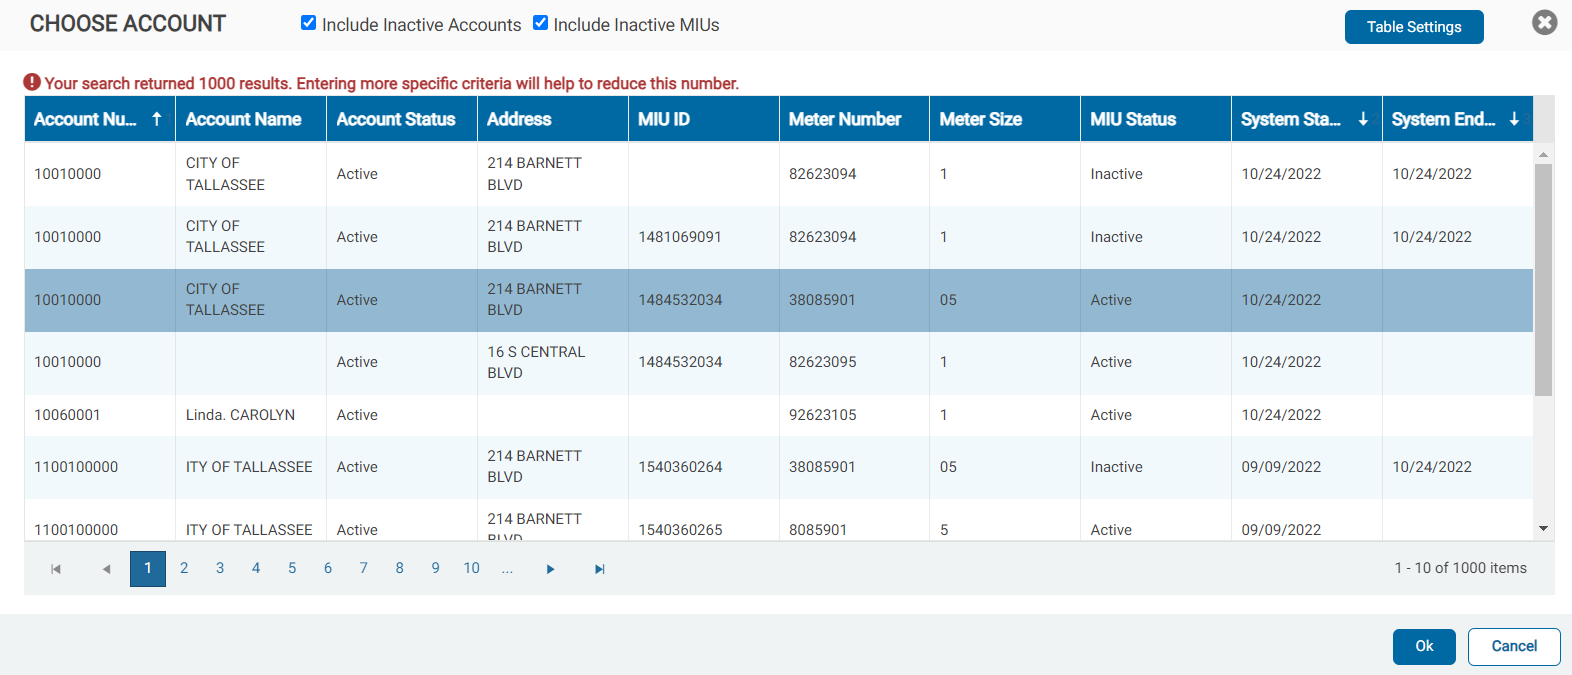
- To exclude inactive accounts or inactive endpoints from the search results, deselect the appropriate check boxes.
- Click Table Settings to display the Add or Remove Columns window. Not all columns display by default.
- Select and deselect the columns you want to show or hide, and then click OK to set the column configuration.
You can sort the items in the grid to find an account quicker. By default, the results are sorted by Account Number, System End Date, and System Start Date.
- Select an account, and then click Ok.
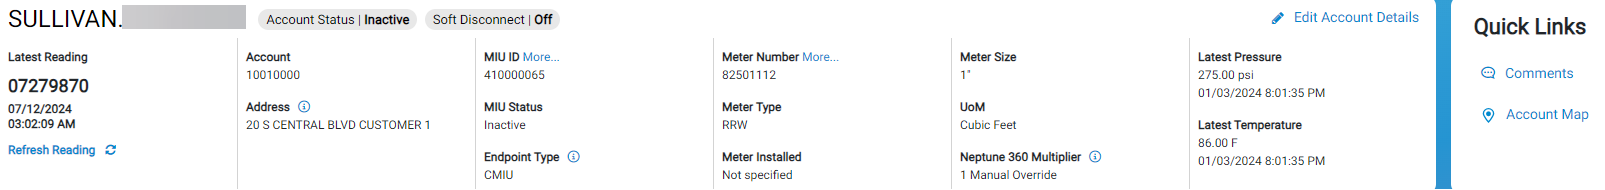
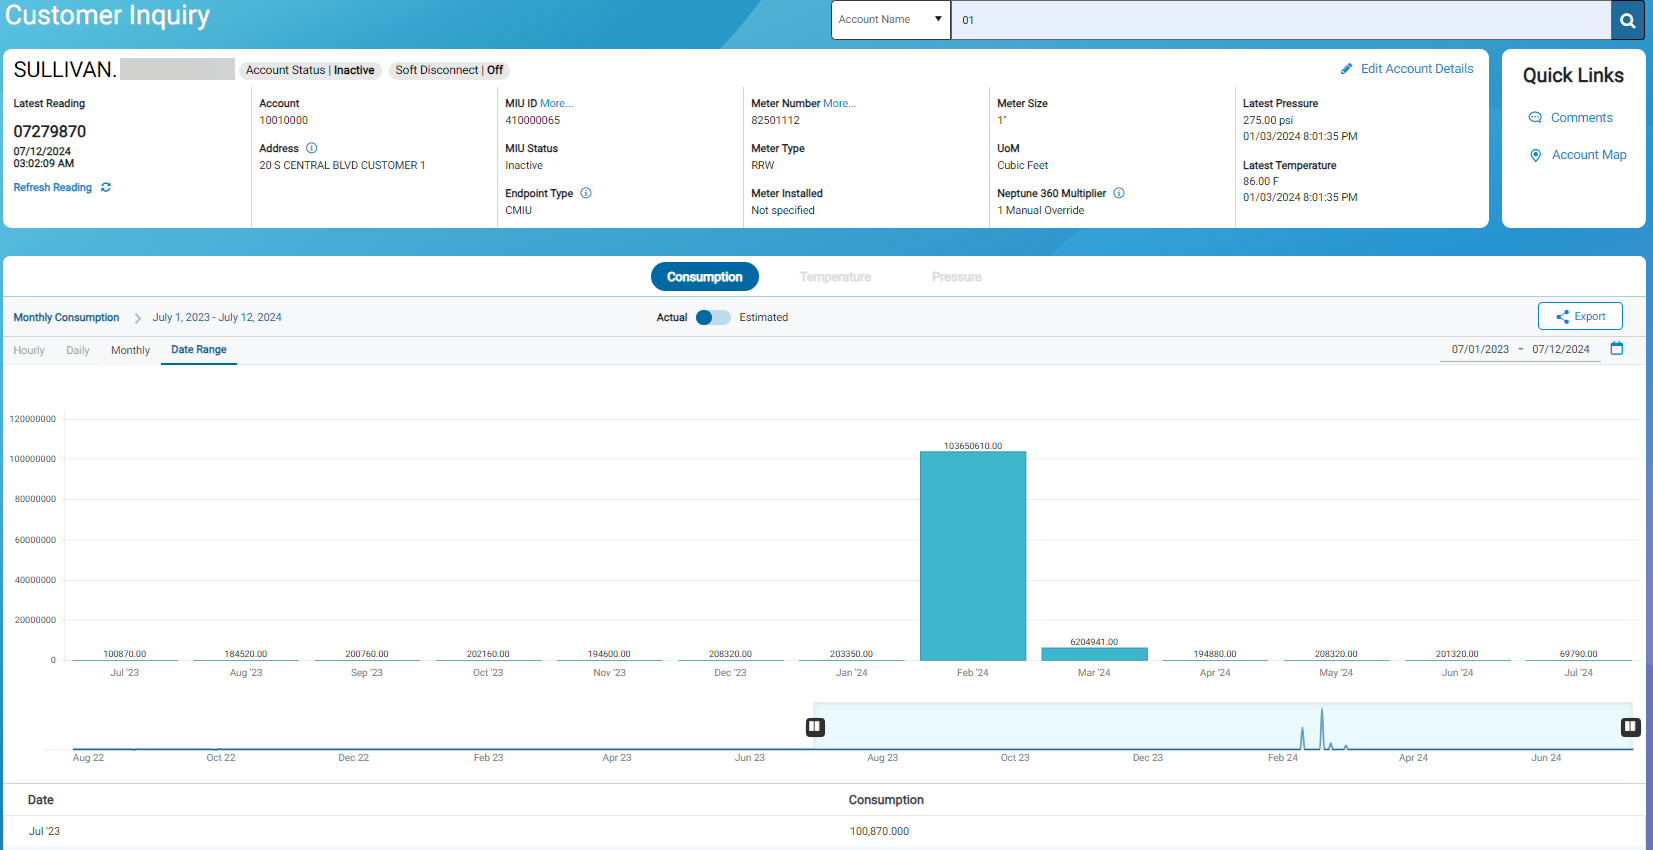
View the Current Account and Meter Information
After selecting a customer account, you can view the account and meter information in the summary section at the top of the page. The following table defines the information.
| Information | Description |
|---|---|
| Account Status Icons |
|
| Account Number | Identification number for the account. |
| Address | Physical address of the meter location. |
| Customer Name | Name on the customer account. The name displays in the top left corner of the page. |
| Endpoint Type | Type of endpoint for the meter as determined using the endpoint ID passed in your import file. |
| Latest Pressure | The most recent meter pressure reading in the UOM |
| Latest Temperature | The most recent meter temperature reading in the UOM you define (Fahrenheit or Celsius), plus the date and time in MM/DD/YYYY hh:mm:ss format. This value is the latest temperature reading (most recent) the endpoint sent. Only meters that have temperature reading capability, such as the MACH 10, display this information. Also note that this capability is only available in conjunction with the cellular endpoint type. The temperature reading is based on historical data. You can select the UOM in which you want to show the temperature reading. Note that if you change the UOM, the system adjusts the temperature scale and reading. |
| Latest Reading |
Latest meter reading along with the date and time of the latest reading. The format of the reading reflects the Read Format selected in your User Profile. The system pads zeros onto readings with fewer than eight digits to ensure consumption calculations are consistent. If the latest reading was skipped, then this column displays the word Skipped, the code, a brief description, and the date and time the Skip code was applied. A lock |
| Meter Number | Identification number for the meter. |
| Meter Size | Size of the meter, in inches. |
| Meter Type | Type of meter, digital or analog. |
| Meter Installed | Date the meter was installed. |
| Endpoint (MIU) ID | Identification number associated with the endpoint. |
| Endpoint (MIU) Status | Status (Active or Inactive) of the endpoint associated with the meter. |
| Neptune 360 Multiplier |
Displays the multiplier and information about how the multiplier is calculated. A manual override make take up to an hour or more to show in the system, if the override impacts consumption. The Comments section on this page also displays a change to the multiplier. |
| Unit of Measure (UOM) | Unit of measure the meter uses. |
 icon indicates that a reading change is currently in progress.
Select a Meter or Endpoint (MIU)
The selected account may have multiple meters or endpoints (MIUs) and you can view information about these other endpoints. The selection window also shows the active dates for each meter or endpoint.
- On the Neptune 360 navigation bar, click Customer Inquiry.
- On the Customer Inquiry page, next to MIU ID or Meter Number, click More... .
- Select the endpoint or meter you want to view, and then click OK.
- Click Edit in the upper right corner of the page to display the Edit Details window.
Display Endpoint in the Data Log Page
An endpoint (MIU) that has been data logged displays the data log icon next to the MIU ID field.
- On the Neptune 360 navigation bar, click Customer Inquiry.
- On the Customer Inquiry page, click the data log icon (
 ) to display the endpoint in the Data Log page, in a separate window.
Refresh a Reading
Refreshing a read displays the latest meter reading for a selected customer.
- On the Neptune 360 navigation bar, click Customer Inquiry.
- On the Customer Inquiry page, verify the correct customer account is displayed. If the correct account is:
- Displayed, go to step 2.
- Not displayed, Search for an Account, and then complete steps 1 and 2 of Select a Meter or MIU to ensure the correct account and meter or endpoint (MIU) is displayed.
- In the Latest Reading section, click
 .
.
The system displays the latest reading (in bold letters) with the date / time stamp and an email notification message.
Receive an Email Notification
You can choose to receive an email that shows the latest reading to share with the customer or other users.
- In the Email Notification that the system displays with the new reading, click Yes.
The system displays an email confirmation.
Edit a Reading
If you have permission, you can edit the last keyed reading. The ability to edit readings ensures a billable reading is ready for export to billing and to correct consumption caused by bad keyed readings. The three scenarios under which you can edit a reading are:
- The latest reading was manually keyed.
- A reading has not been received since the last import for the account.
- The last imported reading was invalid or skipped.
You can edit only the last reading for any given account, unless the reading is on a reading report submitted by a meter reader.
If the account experienced a bad reading prior to the last reading, the bad reading is not editable and the consumption total includes the bad reading.
When you edit a reading, the system saves the original reading for audit purposes. The system performs an audit check on the newly-entered reading and notifies you if the high / low check fails.
- On the Neptune 360 navigation bar, click Customer Inquiry.
- On the Customer Inquiry page, click the pencil icon next to Latest Reading.
The Edit Reading window is displayed and shows the following reading information:
- Account name.
- Meter Number.
- MIU (Endpoint) ID.
- High Limit for the meter (displays only if the Neptune Mobile Setting to display high and low limits is set to Yes).
- Low Limit for the meter (displays only if the Neptune Mobile Setting to display high and low limits is set to Yes).
- Dial (number of digits on the meter dial).
- Latest Reading with the timestamp in MM/DD/YYYY HH:MM:SS AM/PM format.
- In the New Reading field, enter a reading.
- Click Save to save the new reading.
The Comments section displays an automated comment with details on the old reading and the edit you made.
- In the Edit Reading Confirmation box, select the option to either replace the latest reading, or add the reading as a new / additional reading.
- Click Confirm to confirm the reading you added.
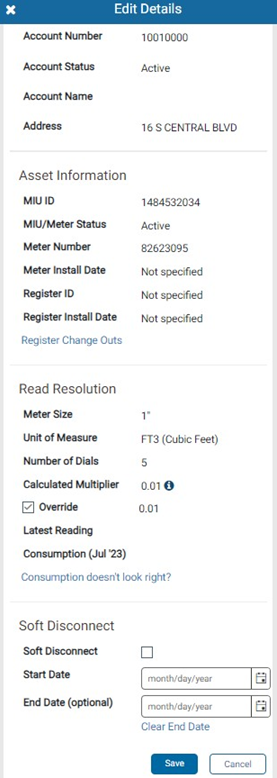
Edit Account Details
You can edit the details for the selected account such as changing out a register, overriding a reading multiplier, and applying a soft disconnect.
- On the Neptune 360 navigation bar, click Customer Inquiry.
- On the Customer Inquiry page, ensure the customer account selected is the one for which you want to make changes.
- Click Edit Account Details to display the Edit Details window.
- Follow the steps to:
- Add or Edit a Register Change Out
- Delete a Register Change Out
- Edit the Meter Size or Unit of Measure
- Override a Multiplier
- Apply a Soft Disconnect
View Register Change Outs
When you view register change outs, the system displays the Register Change Outs grid with old and new register reading information. You can add, edit, and delete register change out information. The Change Out History link displays only after you change out a register.
- On the Neptune 360 navigation bar, click Customer Inquiry.
- On the Customer Inquiry page, ensure the customer account selected is the one for which you want to make changes.
- Click Edit Account Details to display the Edit Details window.
- Click the Register Change Outs link.
| Information | Definition |
|---|---|
| Change Out Date | Date the register was changed out. This field is required. |
| Final Read | Final reading on the old register that was changed out. This field is optional. |
| Beginning Read | Beginning reading on the new register. This field is optional. |
| Old Register ID | ID for the old register. This field is optional. |
| New Register ID | ID for the new register. This field is optional. |
| User | ID for the user who performed a register change out or an action on a change out history entry. |
| Time Stamp | Time stamp for the register change out or change out history entry action, in MM/DD/YYYY hh:mm:ss format AM / PM. |
Add or Edit Register a Change Out
- On the Neptune 360 navigation bar, click Customer Inquiry.
- On the Customer Inquiry page, click Edit Account Details.
- On the Edit Details window, scroll to the Asset Information section.
- Click Register Change Outs.
- On the Register Change Outs grid, do one of the following:
- Click Add to add change out history data
- Select the row for the change out history data you want to edit, and then click Edit.
- Select or enter the change out values as required, and then click Save.
- Verify the Add Register Change Out data values, and then click Confirm.
Delete a Register Change Out
- On the Neptune 360 navigation bar, click Customer Inquiry.
- On the Customer Inquiry page, click Edit Account Details.
- On the Edit Details window, scroll to the Asset Information section.
- Click Register Change Outs.
- On the Register Change Outs grid, click the row for the change out you want to delete.
- Verify the change out entry you want to delete, and then click Delete.
Edit the Meter Size or Unit of Measure
If your import file did not include the meter size or unit of measure, you can edit these values with or without overriding the multiplier. Note that selecting these values may change the current multiplier.
-
You can update the Meter Size and Unit of Measure only if the values for these were excluded from the latest import.
-
Changes to the Meter Size or Unit of Measure may update the Neptune 360 Multiplier. This change is reflected in the Calculated Multiplier value and the resolution of the Latest Reading and Consumption values displayed.
-
Changes to the meter size or unit of measure have no impact on the export file for billing.
- On the Neptune 360 navigation bar, click Customer Inquiry.
- On the Customer Inquiry page, click Edit Account Details.
- On the Edit Details window, scroll to the Read Resolution section.
- In the Meter Size or Unit of Measure field, select the appropriate value.
- Click Save.
Override a Multiplier
The Neptune 360 Multiplier field in the summary section of this page shows the multiplier used for calculating consumption and the method by which the multiplier was provided. The system calculates a default multiplier based on the meter size and the UOM![]() Unit of Measure. for your utility.
Unit of Measure. for your utility.
You can manually override the default multiplier if the field in the import file is blank or was not included in the import file. Otherwise, the system uses the imported value for the multiplier. A manual override may take up to an hour or more to take effect. Neptune 360 disables the Edit button during the data update, so you must wait until the updates are complete to make further edits.
When you change the multiplier, Neptune 360:
-
Displays a comment about the multiplier change in the Comments section.
-
Disables the Edit button while processing updates.
-
Takes up to an hour to update consumption history and display the change.
Neptune 360 allows up to eight digits, one for each dial, for readings sent to the system. Readings that are transmitted and processed into Neptune 360 are raw (without decimal), so to properly calculate readings the system applies a default multiplier based on the meter size and UOM![]() Unit of Measure. for the meter. The multiplier ensures the decimal is in the correct place in the raw data. If a size for a meter is not indicated or is not recognized, then the system applies 5/8" as the default size.
Unit of Measure. for the meter. The multiplier ensures the decimal is in the correct place in the raw data. If a size for a meter is not indicated or is not recognized, then the system applies 5/8" as the default size.
For example, if a raw reading of 12345678 is transmitted and the multiplier is .1, then the divisor is 10 and the reading used for calculations in Neptune 360 is 1234567.8. A multiplier of .01 on the same numbers results in a reading of 123456.78.
- On the Neptune 360 navigation bar, click Customer Inquiry.
- On the Customer Inquiry page, click Edit Account Details.
- On the Edit Details window, scroll to the Read Resolution section.
- Click the Consumption doesn't look right? link.
- Click Override to enable the override function.
- Select the desired multiplier.
Note how the selection change the resolution of the Latest Reading and Consumption values displayed.
- Click Save.
Apply a Soft Disconnect
You can apply a soft disconnect on an account that is not currently in use without having to physically turn off the water. A soft disconnect can suspend service when a customer moves out of a premises until the next customer moves in.
- On the Neptune 360 navigation bar, click Customer Inquiry.
- On the Customer Inquiry page, click Edit Account Details.
- On the Edit Details window, scroll to the Soft Disconnect section.
- Click the Soft Disconnect box to enable the soft disconnect feature.
- In the Start Date field, enter or select the date the soft disconnect on the account begins. The default is the current date.
- In the End Date field, enter or select the date the soft disconnect on the account ends. The date is inclusive of the current date up to 23:59.
This field is optional. If there is no end date, you can end the soft disconnect by deselecting the Soft Disconnect check box. If you enter a date in error or want the end date to be open ended, click Clear End Date.
- Click Save.
Quick Links
This section contains links to the comments and the account map. These functions were moved to this separate section to maximize the screen real estate for the data graph. The Comments option include a total count of the comments associated with the account.
View Comments
If you have the proper permission, you can enter comments on a customer account. Comments enable you to keep a running log of service requests, hardware updates, register change outs, and other pertinent information relating to the account. Use this feature to record customer interactions to better manage the account and provide the best response to customer issues. Each time a user takes action for a register change out, the system adds a comment for these actions, as well.
The most recent comment displays at the top of the Comments section. Accounts that have many comments display them on subsequent pages that you can select. Each comment shows the:
- Date and time the author created the comment.
- Author's email address.
The same information displays for an author who edits a comment.
You can export the list of comments to either a PDF or an Excel file.
- On the Neptune 360 navigation bar, click Customer Inquiry.
- On the Customer Inquiry page, in the Quick Links section, click COMMENTS to display the comments for the selected account.
Add a Comment
- On the Neptune 360 navigation bar, click Customer Inquiry.
- On the Customer Inquiry page, make sure the account for which you want to enter comments is displayed.
- In the Quick Links section, click COMMENTS.
- Click
 to display a text box.
 - Type your comment, and then click Save.
The comment is permanently associated with the account unless you or another user
deletes it.
Edit a Comment
- On the Neptune 360 navigation bar, click Customer Inquiry.
- On the Customer Inquiry page, make sure the account for which you want to edit comments is displayed.
- In the Quick Links section, click COMMENTS.
- Click
 next to the comment you want to edit to enable the text box.
 - Type your edits, and then click Save.
Delete a Comment
You can delete a comment you entered if you have the appropriate permission, even after another user edited the comment. Users can delete other users' comments provided they have the appropriate permission.
- On the Neptune 360 navigation bar, click Customer Inquiry.
- On the Customer Inquiry page, in the Quick Links section, click COMMENTS.
- Next to the comment you want to delete, click
 .
. - In the confirmation box, click Delete.
View the Map
The map displays pin drop icons at the physical location for each meter on the account.
- On the Neptune 360 navigation bar, click Customer Inquiry.
- On the Customer Inquiry page, in the Quick Links section, click Account Map to display the map for the selected account.
- Hover over the pin drop icon to display account location details (
 ).
).

View the Water Consumption Analysis
The Customer Inquiry page displays key metrics for the selected account's water consumption (per the MIU ID). The page shows monthly, daily, and hourly consumption for the date range selected, up to 60 days prior to the current date selected. The total consumption for the selected interval displays in the graph header. By default, water consumption reports show 13 months of data from the date range specified. You can change the date range.
Change the Date Range
- On the Neptune 360 navigation bar, click Customer Inquiry.
- On the Customer Inquiry page, in the Consumption section, click Date Range.
- Click
 to display the calendar.
 - Select the first (from) date in the range.
- Select the last (to) date in the range.
- Click Done.
 left and right to change the date range and the resulting data in the KPI.
View the Consumption Data
- On the Neptune 360 navigation bar, click Customer Inquiry.
- On the Customer Inquiry page, click Consumption to display consumption data.
About the Monthly Consumption Analysis Chart
This bar graph displays the consumption volume for each month.
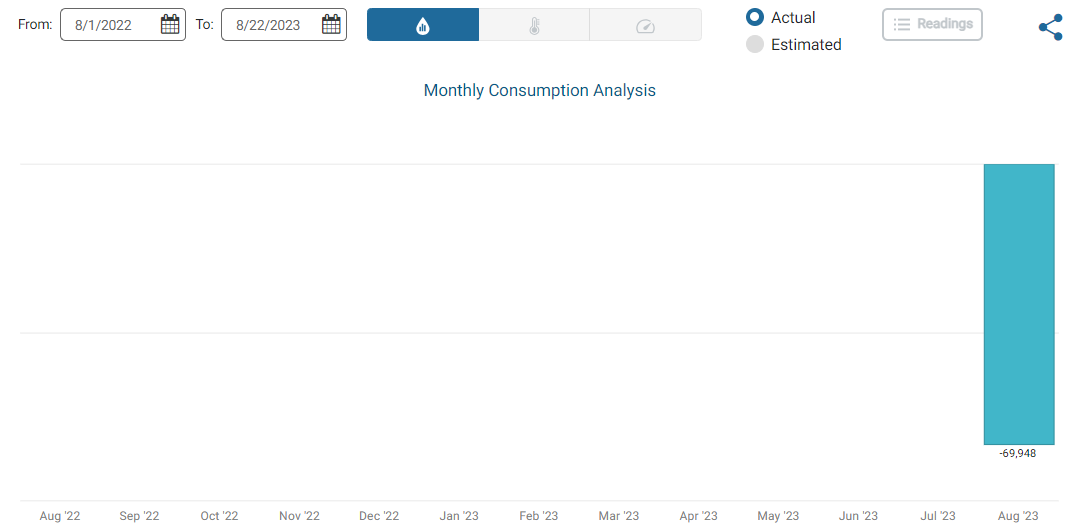
You can export the Monthly Consumption grid view to a PDF![]() Portable Document Format. An Adobe Inc. file format used to present and share documents independent of the computer, device, or software used to view it. file or Excel spreadsheet.
Portable Document Format. An Adobe Inc. file format used to present and share documents independent of the computer, device, or software used to view it. file or Excel spreadsheet.
About the Daily Consumption Analysis Chart
The Daily Consumption Analysis chart contains a total of the daily consumption per account endpoint (MIU). The bar graph represents the volume of consumption. The trend line (grid) shows the hourly consumption for a given day as well as the daily consumption and the last reading value for that day.
If a register change out is made and set, the system shows a new event flag (yellow) for the register change out on the daily consumption graph. The system also recalculates the consumption for that day, if the readings fields are provided in the change out configuration. Otherwise, the consumption for that change out day does not display.
The Daily Consumption Analysis includes Usage Event Flags. These flags are provided by the E-CODER® register.
| Dark green – Major Reverse | |
| Light green – Minor Reverse | |
| Purple – Continuous Consumption | |
| Light blue – Intermittent Consumption | |
| Black – No Flow | |
| Yellow – Register Change Out – provided from a register change out configuration |
When you drill down on a graph, you can hover over a colored flag to display the usage event – Major, Minor, Continuous, Intermittent, and Change Out.
Display the Daily Consumption Chart and Graph
- On the Neptune 360 navigation bar, click Customer Inquiry.
- On the Customer Inquiry page, change the date range, if needed.
- On the Monthly Consumption bar graph, click the bar for which you want to display daily consumption data.
- The system displays the Daily Consumption Analysis bar chart and graph.
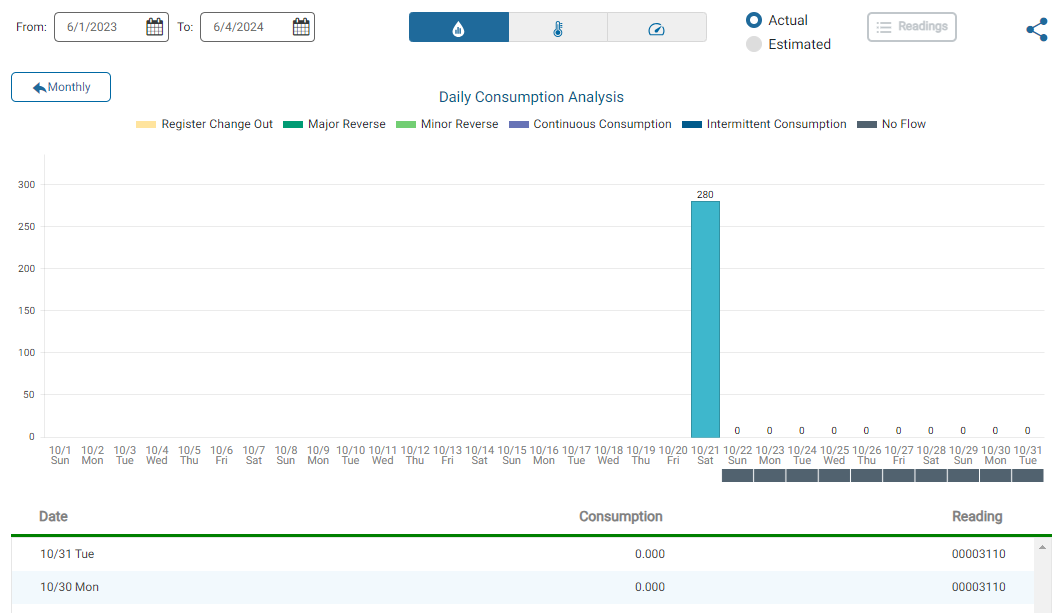
- Hover over the representation of the hourly data for that row's day to display a numeric value of the total water consumption for the day. The consumption displays in the endpoint's specified UOM.
If desired, you can export the grid or graph to another format, such as an Excel file or a PDF file.
About the Hourly Consumption Analysis Chart
The Hourly Consumption Analysis chart displays consumption by hour for the endpoint (MIU) associated with the account. The trend line displays the Hour, Flow Events (if any), Hourly Consumption and Reading (the last reading broadcast within that hour).
Display the Hourly Consumption Chart
- On the Neptune 360 navigation bar, click Customer Inquiry.
- On the Customer Inquiry page, click Daily to display the daily consumption within the month or date range selected.
- On the Daily Consumption Analysis chart, click the bar for the day for which you want to display hourly consumption
-
The system displays the Hourly Consumption Analysis chart. You can change the date range on this chart.
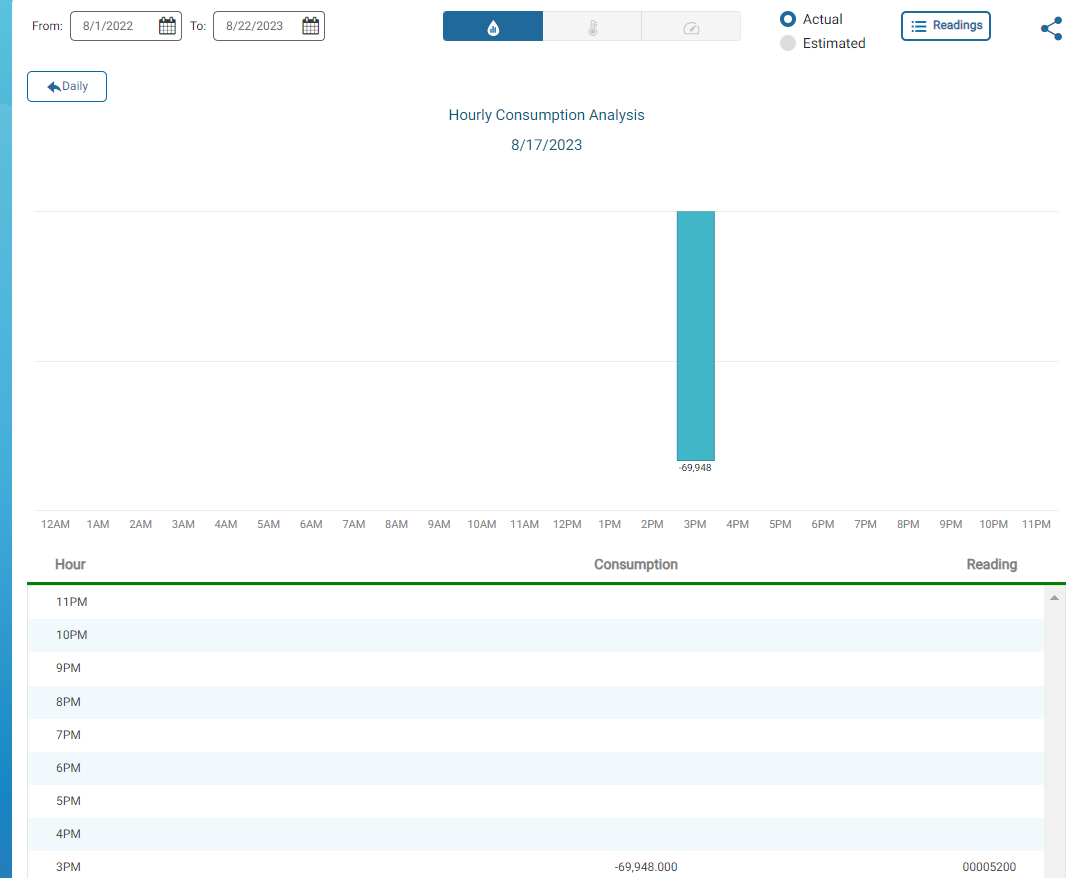
Display Readings
The readings grid contains all readings received for the entire day displayed in 15-minute intervals. The readings display by date and time in ascending order. You can export the readings to an Excel file or to a PDF file.
- On the Neptune 360 navigation bar, click Customer Inquiry.
- On the Customer Inquiry page, on the Hourly Consumption, Pressure, or Temperature Analysis chart, click a bar to display the readings for the day in 15-minute intervals.
 . This button is available for all devices except the R450, which is read only once per day.
The following table defines the data in the All Readings grid. You can hover over any flag to display an explanation of the flag.
| Information | Description |
|---|---|
| Date | Date and time the reading occurred in MM/DD/YYYY HH:MM:SS format. |
| Reading | Reading for the 15-minute interval. |
| Consumption Flag | Consumption flag that applies to the reading, either Continuous or Intermittent. |
| Reverse Flow Flag | Reverse flow flag that applies to the reading, either Major or Minor. |
| Empty Pipe Flag | Displays Active if the pressure sensor detects an empty pipe indicating a lack of water flow. |
| Freeze Warning | Displays Active if the temperature sensor detects a temperature conducive to freezing the water in the pipe. The system triggers the alert when the water temperature reaches 32.9F or 0.5C. |
- Click
 to return to the Hourly Consumption Analysis graph.
View the Water Pressure or Temperature Analysis
The Customer Inquiry window displays key metrics for the selected account's water pressure and water temperature, for accounts that have cellular endpoints with the capability to track pressure and temperature, such as the MACH 10®. The cellular networks that work with the endpoints to collect pressure and temperature data are Verizon in the U.S. and FirstNet in Canada.
The summary section of the page shows the latest water pressure, based on historical pressure data from up to the past 24 months, based on the date range you select. Pressure and temperature readings are an average of the collected readings over the defined interval period. A Latest Pressure or Latest Temperature reading of N/A indicates the threshold for the pressure or temperature alert is not currently set.
The data show monthly, daily, and hourly pressure or temperature for the date range selected. By default, water consumption, pressure, and temperature reports show up to 24 months of data from the date range specified. From the monthly readings, you can click a bar on the graph to drill down to daily readings. Drilling down on a daily reading shows hourly readings that occur at 15 minute intervals.
If there is a problem with the reading or the meters, the Pressure / Temperature column on the grid and the Pressure / Temperature field in the summary displays Sensor Error. Any active flags display in separate grid columns. For readings other than monthly, flags appear below the date or day bar on the grid. Sensor errors include:
- No Sensor Present, Feature not Supported – the meter does not support pressure or temperature readings.
- Invalid Reading – the sensor could not interpret the reading or a reading has not yet occurred.
- Bad Sensor – the sensor is no longer working.
- Sensor Out of Range, Low – the sensor value is lower than the smallest value the meter can register.
- Sensor Out of Range, High – the sensor value is higher than the highest value the meter can register.
- Read Failure – the sensor attempted but failed to read the meter.
- Read Unavailable – the sensor interrogated the meter but did not receive a reading.
- On the Neptune 360 navigation bar, click Customer Inquiry.
- On the Customer Inquiry page, select the account for which you want to view water pressure or temperature.
- In the section below the summary section click Temperature or Pressure to display the related data.
The graph shows the readings by month for the date range selected.
- The bottom blue dashed line in the graph represents the minimum threshold setting.
- The top red dashed line in the graph represents the maximum threshold setting.
- The UOM Unit of Measure. for each threshold setting appears above the graph.
- Any flag, such as the empty pipe flag, that indicates an issue with the meter or the pipe.
- Verify and change the date range, if desired.
- Click a bar in the graph to display reading details.
- If you do not currently have minimum and maximum thresholds set (indicated by N/A displaying for the Latest Pressure or Latest Temperature reading) or you want to edit the thresholds, you can click
 to set up or edit an alert threshold now. Note that the system adjusts the readings and scale based on historical data.
If desired, you can export the grid or graph to another format, such as an Excel file or a PDF file.
Water Pressure and Temperature Notifications
You can subscribe to alert notifications so that you receive a notification when either a pressure reading or a temperature reading is above or below the threshold you set. Alert notifications alert you of any warning flags such as an empty pipe or a pipe freeze warning. An empty pipe can indicate the meter or one of the pipes is faulty, or a wire has been cut. A freeze warning can cause an empty pipe warning as the water does not flow and pressure is not detected.
You can receive alerts via email that you can forward to the customer, and also receive alerts through the Action Center.
